In the world of the TV series Star Trek, teleportation is just like taking the bus. You press a button – “beam me up!” – and suddenly you’re somewhere else entirely. It’s the most ordinary thing in the world.
The Star Trek series is, of course, science fiction. But in our real world, we have quantum computing, and in that context, teleportation is just as commonplace as it is in Star Trek. In fact, the concept of teleportation is one of the very foundations of quantum computing.
So is teleportation not science fiction after all?
In this article, I’ll explain what quantum computers are and what they can—and cannot—do. I’ll discuss how this new technology compares to the everyday computers we’ve been familiar with for decades.
And we’ll see whether teleportation is science fiction or a new reality.
Classical computers and Quantum computers
Since the emergence of quantum computers, the computers we use every day have been relegated to the “classical” category. We now have two types of computers: quantum and classical. And they work in different ways.
The foundation of classical computers: bits
The foundation of classical computers is the bit. This unit can have a value of 1 or 0 – true or false. It is one of two possibilities: binary.
Bits can be used to perform calculations through logical operations, known as binary logic. In electronics, we can use components such as transistors to assemble this binary logic into logical circuits: the classical computer.
The foundation of quantum computers: qubits
The smallest unit of a quantum computer is not the same as the bit in a classical computer. A quantum computer operates using something that is harder to imagine: a unit that can have two values at the same time. This is called a qubit, or a quantum bit.
You can also perform calculations with qubits, but this works fundamentally differently from classical bits. Instead of binary logic (where a bit is either 0 or 1), qubits utilize the principles of quantum mechanics. This enables quantum computers to perform parallel computations in a way that classical computers cannot match. Using quantum components, we can build quantum circuits that apply quantum logic and thus perform computations: the quantum computer.
Why a quantum computer
We have seen that a qubit can have two values at the same time. This also means that we can perform operations on both values of the qubit (called qubit states) simultaneously. With a classical bit, such parallel processing is not possible.
The parallelism in qubits is what gives the quantum computer its enormous speed. And the more qubits you use, the greater the advantage of this parallelism becomes.
For calculations that can take advantage of this property, the quantum computer is therefore much, much faster than a classical computer.
Quantum: Not a Panacea
In principle, a classical computer can solve any problem that is computable. The renowned mathematician Alan Turing, the British mathematician who cracked the German Enigma code during World War II, proved this as early as 1936. That was even before usable computers could be built.
Unfortunately, a quantum computer is not as universally applicable as a classical computer. Quantum computers are particularly suited for specific problems that are difficult for classical computers to solve, such as:
Cracking certain encryption algorithms (which also poses risks to cybersecurity).
Logistics optimization, such as finding the most efficient routes for delivery services.
Simulations of quantum systems, for example, for materials research or drug development.
These applications are often still in the experimental phase and require further development before they can be deployed at scale.
The quantum computer is not a panacea.
Hybrid computer: the best of both worlds
So, the quantum computer cannot replace the classical computer. We will continue to use classical computers for most of the applications we currently use them for. The quantum computer will be used for the specific applications in which it excels—in combination with classical computers.
So, that mysterious quantum computer with its qubits and strange properties is actually quite limited. Myth busted.
Teleportation: So what about that?
But what about that teleportation thing with the quantum computer? That sounds pretty fancy, doesn’t it?
We’ve seen that the basis of quantum computing is the qubit. A strange property of qubits is that you can link them together: you can put them into an “entangled” state. If you change one qubit in such an entangled pair, you also change the other qubit. And the surprising thing is: those entangled qubits can be located far apart from each other, and yet still influence each other.
You can change the state of a qubit and thereby directly influence the state of an entangled qubit at a distance: “Beam me up, Scotty!”
This is called quantum teleportation, but it involves only the transfer of quantum information (e.g., the state of a qubit), not the physical movement of matter. So it’s not the same as teleporting people in Star Trek. Moreover, quantum teleportation always requires a classical signal (e.g., via radio or cable) to complete the teleportation, meaning it cannot travel faster than light.
This isn’t true teleportation like in Star Trek. It’s about sending information, not moving people. And this quantum teleportation has even more limitations. But the researchers who studied the phenomenon enjoyed using it to grab attention and make the concept accessible. And they were successful at it, because we’re still talking about it today!
So, is it science fiction after all?
Quantum computing is real, and its potential is genuine. But it is not magic, and it is not imminent for most organizations.
The future is not quantum or classical – it is quantum and classical. Organizations will run hybrid environments where quantum processors handle specific computations, while classical systems manage everything else. The integration of these two worlds is where the real work will happen.
The quantum computer will not replace your classical infrastructure. What it will do is complement it, for the specific problems it solves best.
When a critical application update requires new infrastructure, such as additional storage, network configuration changes, or middleware adjustments, how long does your mainframe team wait? In many organizations, what takes minutes in cloud environments can stretch to days or weeks on the mainframe. This is not a technology limitation. It’s a process problem that mainframe infrastructure automation can solve.
The mainframe community has made significant strides in adopting DevOps practices for application development. Build automation, continuous integration, and automated testing are becoming standard practices. But application agility means little if infrastructure changes remain bottlenecked by manual processes and ticket queues.
The solution lies in applying the same DevOps principles to infrastructure that we’ve successfully applied to applications. This means standardization, automation, and treating infrastructure definitions as code. While the journey presents unique challenges, particularly around tooling maturity and organizational culture, the mainframe platform is ready for this evolution. This article explores how to bring infrastructure management into the DevOps era.
Standardization and automation of infrastructure
Like the build and deploy processes, all infrastructure provisioning must be automated to enable flexible and instant creation and modification of infrastructure for your applications.
Automation is only possible for standardized setups. Many mainframe environments have evolved over the years. A practice of rigorously standardized infrastructure setups was likely at the root of the setup. However, cleaning up is not generally a forte of IT departments in many organizations. A platform with a history as long as the mainframe often suffers even more from such a lack of cleanliness.
Standardization, legacy removal, and automation must be part of moving an IT organization toward a more agile way of working.
Infrastructure as Code: Principles and Practice
When infrastructure setups are standardized and automation is implemented, the code that automates infrastructure processes must be created in a similar manner to applications-as-code. There is no room anymore to do things manually. Everything should be codified.
Just as CI/CD pipelines are the code bases for the application creation process, infrastructure pipelines are the basis for creating reliable infrastructure code. Definitions of the infrastructure making up the environment must be treated like code and managed in a source code management system, where they can be properly versioned. The code must be tested in a test environment before deployment to production.
In practice, we see that this is not always possible yet. We depend on infrastructure suppliers for hardware, operating systems, and middleware. Not all hardware and middleware software are equipped with sufficient automation capabilities. Instead, these tools depend on human processes. Suppliers should turn their focus from developing sleek user interfaces to providing modern, most likely declarative, interfaces that allow for handling the tools in an infra-as-code process.
A culture change
In many organizations, infrastructure management teams are among the last to adopt agile working methods. They have always been so focused on keeping the show on the road that the risks of continuity disruptions have prevented management from having teams focus on development infrastructure-as-code.
Also, the infrastructure staff are often relatively conservative when it comes to automating their manual tasks. Usually not because they do not want it, but because they are so concerned about disruptions that they would rather get up at 3 a.m. to make a manual change than risk a programming mistake in the automation infra-as-code solution.
When moving towards infrastructure-as-code, the concerns of the infrastructure department management and staff should be taken seriously. Their continuity concerns can often be used to create extra robust infrastructure as a code solution. What I have seen, for example, is that staff do not just worry about creating infra-as-code changes but are most concerned about scenarios in which something could go wrong. Their ideas for rolling back changes have often been eye-opening toward a reliable solution that not only automates happy scenarios but also caters to unhappy scenarios.
However, the concern for robustness is not an excuse for keeping processes as they are. Infrastructure management teams should also recognize that there is less risk in relying on good automation than on individuals executing complex configuration tasks manually.
The evolving tooling landscape
The tools available for the mainframe to support infrastructure provisioning are emerging and improving quickly, yet they are still incoherent. Tools such as z/OSMF, Ansible, Terraform, and Zowe can play a role, but a clear vision-based architecture is missing. Work is ongoing at IBM and other software organizations to extend this lower-level capability and integrate it into cross-platform infrastructure provisioning tools such as Kubernetes and OpenShift. Also, Ansible for z/OS is quickly emerging. There is still a long way to go, but the first steps have been made.
Conclusion
The path to infrastructure-as-code on the mainframe is neither instant nor straightforward, but it’s essential. As application teams accelerate their delivery cycles, infrastructure processes must keep pace. The good news is that the fundamental principles are well established, the initial tooling exists, and early adopters are proving it works.
Success requires three parallel efforts: technical standardization to enable automation, cultural transformation to embrace change safely, and continuous pressure on vendors to provide automation-friendly interfaces. These don’t happen sequentially. They must advance together.
Start by assessing your current state. Inventory your infrastructure processes and identify which are already standardized and repeatable. Then choose one well-understood, frequently performed infrastructure task and automate it end to end, including rollback scenarios. Most importantly, engage your infrastructure team early. Their operational concerns will make your automation more robust, not less.
The mainframe has survived and thrived for decades by evolving. Infrastructure as code is simply the next evolution, ensuring the platform remains competitive in an increasingly agile world.
The mainframe has survived and thrived for decades by evolving. Infrastructure as code is simply the next evolution, ensuring the platform remains competitive in an increasingly agile world.
Getting started: your first IaC step
Inventory your infrastructure processes
Identify one standardized, frequently performed task
Automate it end to end including rollback
Engage your infrastructure team early
Measure before and after: time, errors, incidents
Are you already on this journey? I’d love to hear where your organization stands— leave your thoughts below.
[Explore more mainframe modernization topics in my book Don’t Be Afraid of the Mainframe →](https://execpgm.org/dbaotm-the-book/)
This topic is covered in depth in my book Don’t Be Afraid of the Mainframe: The Missing Introduction for IT Leaders and Professionals—including practical frameworks for modernizing your mainframe infrastructure and development practices. Learn more and order here →
This article is an extension of a presentation on mainframe resilience a colleague and I gave at the GS NL 2025 conference, in Almere on June 5, 2025.
Introduction
In this article, I will examine today’s challenges in IT Resilience and look at where we came from with mainframe technology. Today’s resilience is no longer just threatened by natural disasters or equipment failures. Today’s IT resilience must include measures to mitigate the consequences of cyberattacks, rapid changes in the geopolitical landscape, and the increasing reliance on IT services by international dependencies.
IT resilience is more important than ever. Regulatory bodies respond to changes in these contexts more quickly than ever. Yet our organizations should be able to anticipate these changes more effectively. Where a laid-back organizational ‘minimum viable solution’ approach was taken, the speed of change drives us to more actively anticipate changes, and cater for disaster scenarios before regulatory bodies force us to. And suppose you are not in an organization that is regulated. In that case, you may still need to pay close attention to what is happening to safeguard your continued market position and even the existence of your organization.
In this article, I will discuss some areas where we can improve the technical capabilities of the mainframe. As we will see, the mainframe’s centralized architecture is well-positioned to further strengthen its position as the most advanced platform for data resilience.
A production system and backups
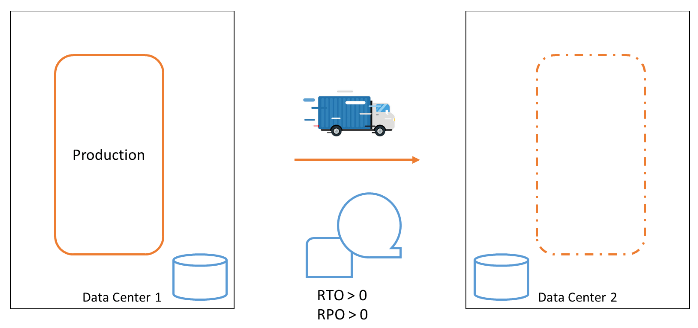
Once we had a costly computer system. We stored our data on an expensive disk. Disk crashes were regularly happening, so we made backups on tape. When data was lost or corrupted, we restored it from the tape. When a computer crashed, we recovered the system and the data from our backups. Of course, downtimes would be considerable – the mean time to repair, MTTR, was enormous. The risk of data loss was significant: the recovery point objective, RPO, was well over zero.
A production system and a failover system
At some point, the risk of data loss and the time required to recover our business functions in the event of a computer failure became too high. We needed to respond to computer failures faster. A second data center was built, and a second computer was installed in it. We backed up our data on tape and shipped a copy of the tapes to the other data center, allowing us to recover from the failure of an entire data center.
We still had to make backups at regular intervals that we could fall back to, leaving the RPO still significantly high. But we had better tolerance against equipment failures and even entire data center failures.
Our recovery procedures became more complex. It was always a challenge to ensure our systems would be recoverable in the secondary data center. The loss of data could not be prevented. The time it took to get the systems back up in the new data center was significant.
Clustering systems with Parallel Sysplex
In the 1990s, IBM developed a clever mechanism that creates a cluster of two or more MVS (z/OS) operating system images. This included advanced facilities for middleware solutions to leverage such a cluster and build middleware clusters with unparalleled availability. Such a cluster is called a Parallel Sysplex. The members—the operating system instances—of a Parallel Sysplex can be up to 20 kilometers apart. With these facilities, you can create a Parallel Sysplex that spans two (or more) physical data centers. Data is replicated synchronously between the data centers, ensuring that any change to the data on the disk in one data center is also reflected on the disk in the secondary data center.
The strength of the Parallel Sysplex is that when one member of the Parallel Sysplex fails, the cluster continues operating, and the user does not notice. An entire data center could be lost, and the cluster member(s) in the surviving data center(s) can continue to function.
With Parallel Sysplex facilities, a configuration can be created that ensures no disruption occurs when a component or data center fails, resulting in a Recovery Time Objective (RTO) of 0. This allows operation to continue without any loss of data, with a Recovery Point Objective (RPO) of 0.
Continuous availability with GDPS
In addition to the Parallel Sysplex, IBM developed GDPS. If you lose a data center, you eventually want the original Parallel Sysplex cluster to be fully recovered. For that, you would need to create numerous procedures. GDPS automates the task of failover for members in a sysplex and the recovery of these members in another data center. GDPS can act independently in failure situations and initiate recovery actions.
Thus, GDPS enhances the fault tolerance of the Parallel Sysplex and eliminates many tasks that engineers would otherwise have to execute manually in emergency situations.
Valhalla reached?
With GDPS, the mainframe configuration has reached a setup that could genuinely be called continuously available. So is this a resilience walhalla?
Unfortunately not.
The GDPS configuration also has its challenges and limitations.
Performance
The first challenge is performance. In the cluster setup, we want every change to be guaranteed to be made in both data centers. At any point in time, one entire data center could collapse, and still, we want to ensure that we have not lost any data. Every update that must be persisted must be guaranteed to be persisted on both sides. To achieve this, an I/O operation must not only be performed locally in the data center’s storage, but also in the secondary data center. Committed data can therefore only be guaranteed to be committed if the storage in the secondary data center has acknowledged to the first data center that an update has been written to disk.
To achieve this protocol, which we call synchronous data mirroring, a signal with the update must be sent to the secondary data center, and a confirmation message must be sent back to the primary data center.
Every update requires a round-trip, so the minimum theoretical latency due to distance alone is approximately 0.07 milliseconds—that is, the speed of light traveling 10 kilometers and back. In practice, actual update time will be higher due to network equipment latency, such as in switches and routers, protocol overhead, and disk write times. For a distance of 10 kilometers, an update could take between 1 and 2 milliseconds. This means for one specific application resource, you can only make 1000 to 500 updates per second. (Many resource managers, like database management systems, fortunately, provide a lot of parallelization in their updates.)
In other words, a Parallel Sysplex cluster offers significant advantages, but it also presents challenges in terms of performance. These challenges can be overcome, but additional attention is necessary to ensure optimal application performance, which comes at the cost of increased computing capacity required to maintain this performance.
Cyber threats
Another challenge has grown in our IT context nowadays: threats from malicious attackers. We have connected our IT systems to the Internet to allow our software systems to interact with our customers and partners. Unfortunately, this has also created an attack surface for individuals with malicious intent. Several types of cyberattacks have become a reality today, and cyber threats have infiltrated the realms of politics and warfare. Any organization today must analyse its cyber threat posture and defend against threats.
One of the worst nightmares is a ransomware attack, in which a hostile party has stolen or encrypted your organization’s data and will only return control after you have paid a sum of money or met their other demands.
The rock-bottom protection against ransomware attacks is to save your data in a secure location where attackers cannot access or manipulate it.
Enter Cybervault
A Cybervault is a solution that sits on top of your existing data storage infrastructure and backups. In a Cybervault, you store your data in a way that prevents physical manipulation: you create an immutable backup of your data.
In our mainframe setup, IBM has created a solution for this: IBM Z Cyber Vault. With IBM Z Cybervault, we add a third leg to our data mirroring setup, an asynchronous mirror. From this third copy of our data, we can create immutable copies. This solution combines IBM software and storage hardware. With IBM Z Cyber Vault, we can make a copy of all our data at regular intervals as needed. Typically, we can make an immutable copy every half hour or every hour. Some IBM Z users take a copy just once every day. This frequency can be configured. From every immutable copy, we can recover our entire system.
So now we have a highly available configuration, with a cyber vault that allows us to go back in time. Great. However, we still have more wishes on our list.
Application forward recovery
In the great configuration we have just built, we can revert to a previous state if data corruption is detected. When the corruption is detected at time Tx, we can restore our copy from time T0, the backup closest to the moment T1 of data corruption.
Data between the corruption at T1 and the detection at Tx is lost. But could we recover as much of the data that was still intact after the backup was made (T0) and before the corruption occurred (T1)?
Technically, it is possible to recover data in the database management system Db2 using the image copies and transaction logs that Db2 uses. With Db2 recovery tools, you can recover an image copy of a database and apply all changes from that backup point forward, using the transaction logs in which Db2 records all changes it makes. When we combine this technology with the Cybervault solution, we would need a few more facilities:
A facility to store Db2 image copies and transaction logs. Immutable, of course.
A facility to let Db2, when restored from some immutable copy, know that there are transaction logs and archive logs made in the future, to which it can perform a forward recovery.
That is work, but it is very feasible.
Now, we have reached a point where we have created a highly available configuration, with a cybervault that can recover from a point as close to the point of corruption as possible.
Adding Linux workloads
Most of today’s mainframe users run Linux workloads on the mainframe, besides the traditional z/OS workloads. These workloads are often as business-critical as the z/OS workload. Therefore, it is great that we can now also include Linux workloads, including OpenShift container-based workloads, in the superb resilience capabilities of IBM Z.
Challenges
As such, we have extended the best-in-class resilient platform. Unfortunately, we are pushed further to address today’s challenges.
What if your backup is too close to your primary data?
Data Centers 1 and 2, as discussed above, may be too close to each other. This is the case when a disaster can occur that affects operations in both data centers. These could include natural disasters, such as a power outage or a plane crash.
I have called them Data Centers so far. Yet, the more generic term in the industry is Availability Zones. An Availability Zone is a (part of) Data Center that has independent power, cooling, and security, just like a Data Center. When you spread your IT landscape over availability zones, or data centers across geographical distances, you put them in different Regions. Regions are geographic areas, often with different risk profiles for disasters.
The Data Centers, or Availability Zones, are relatively close together, especially in European organizations. They are in the same Region. With the recent changes in political and natural climate, large organizations are increasingly looking to address the risks in their IT landscape and add data center facilities in another Region.
Cross-region failover and its challenges
To cater to a cross-region failover, we need to change the data center setup. With our GDPS technology, we can cater for this by adding a GDPS Global ‘leg’ to our GDPS setup. The underlying data replication is Global Mirror replication, asynchronous.
The setup in this last picture summarizes the state of the art of the basic infrastructure capabilities of the mainframe. In comparison to other computing platforms, including cloud, the IBM Z infrastructure technologies highlighted here provide a comprehensive resilience solution for all workloads on the platform. This simplifies the realization and management of the resilience solution.
More challenges
Yet, there remains enough to be decided and designed, such as:
Are we going to set up a complete active-active configuration in Region B, or do we settle for a stripped-down configuration? Our business will need to decide whether to plan for a scenario in which our data center in Region A is destroyed and we cannot switch back.
Where do we put our Cybervault? In one region, or in both?
How do we cater for the service unavailability during a region switch-over? In our neat, active-active setup, we can switch between data centers without any disruption. This is not possible with a cross-region failover. Should we design a stand-in function for our most business-critical services?
We could lose data between our regions. The data synchronization is asynchronous. How should we cater for this potential data loss?
When tackling questions about risk, it all begins with understanding the organization’s risk appetite: the level of risk the business is willing to accept as it works toward its objectives. Leadership teams must decide which risks are best handled through technical solutions. For organizations operating in regulated spaces, regulators set minimum standards.
The bottom line on mainframe resilience
No other computing platform offers the combination of capabilities described in this article: zero RTO/RPO clustering, automated failover, immutable cyber vaults, forward recovery, and cross-region replication, all integrated into a single platform.
The remaining questions are not technical. They are strategic: How much resilience does your organization need? What is your risk appetite? And how does your mainframe resilience strategy connect to your broader IT and cloud strategy?
These are exactly the kinds of decisions explored in my book Don’t Be Afraid of the Mainframe. Chapter 12 covers system management and availability in depth, while the strategic decision frameworks in Part 3 help you translate technical capabilities into business choices.
Apache Kafka is the de facto standard open-source event streaming platform. In event-driven architectures, applications publish events when data changes, allowing other systems to react in real-time rather than polling for updates.
An example is a CRM application that serves as the system of record for customer data. When a customer’s address changes, instead of having every application repeatedly query the CRM for current address data, the CRM can publish an ‘address-update’ event. Interested applications subscribe to these events and maintain their own current copy of the data.
Kafka provides native programming interfaces for Java, Python, and Scala. This article demonstrates how traditional z/OS applications can participate in Kafka-based event streaming using IBM MQ and Kafka Connect.
Native Kafka programming interfaces and Kafka Connect
Applications can interact directly with Kafka through native programming interfaces. Kafka, being Java-based, naturally supports Java applications. Other languages with native Kafka support include Python and Scala. IBM recently introduced a Kafka SDK for COBOL on z/OS, though I will not explore that approach here.
Kafka Connect bridges the gap for applications without native Kafka support. This open-source component sits between Kafka and other middleware technologies like databases and messaging systems, translating between their protocols and Kafka’s event streaming format.
Solution Architecture
Our solution enables z/OS applications to produce and consume Kafka events through IBM MQ, leveraging the well-established asynchronous messaging patterns familiar to mainframe developers.
Key Benefits:
Uses proven MQ messaging patterns
Works with both CICS online and batch applications
Supports any z/OS programming language that can create MQ messages (COBOL, PL/I, Java, Python, Node.js, Go)
No application code changes required beyond message formatting
Architecture Overview
The solution uses Kafka Connect as a bridge between MQ queues and Kafka topics.
For Event Production:
z/OS applications send messages to dedicated MQ queues
Kafka Connect reads from these queues
Messages are published to corresponding Kafka topics
Kafka broker makes events available to subscribers
For Event Consumption:
Kafka Connect subscribes to Kafka topics
Incoming events are placed on corresponding MQ queues
z/OS applications read from queues for business processing
Queue-to-Topic Mapping
Each Kafka topic has a dedicated MQ queue. This one-to-one mapping simplifies configuration and makes the data flow transparent for both operations and development teams.
Software Components
Kafka Connect runs as a started task on z/OS. Multiple instances can serve the same workload by sharing startup parameters, providing scalability and high availability. Kafka Connect includes a REST API for:
Configuring connectors for your applications
Monitoring connector status
Integrating with provisioning and deployment processes
Production Configuration
In a production environment, multiple Kafka Connect instances run across different LPARs for high availability. Each instance accesses application queues through MQ local binding connections. MQ queue sharing groups distribute workload across LPARs, ensuring both performance and resilience.
The infrastructure setup supports:
Load balancing across multiple z/OS instances
Fault tolerance through redundant components
Efficient local MQ connections
Summary
This article describes an architecture that provides a clean, straightforward path for z/OS applications to participate in event-driven systems using Apache Kafka. By leveraging existing MQ messaging patterns and Kafka Connect middleware, traditional mainframe applications can integrate with modern streaming platforms without requiring extensive code changes or new programming paradigms. The solution maintains the reliability and performance characteristics that z/OS environments demand while opening doors to real-time data integration and event-driven architectures.
I often realize I’m doing repetitive tasks that could easily be automated. Money transfers, reminders, invoices-these are simple, low-effort activities that don’t deserve to consume my time. Every time this happens, I tell myself, “I should automate this to save time and mental effort.” And yet, somehow, I don’t. I tell myself I have no time to automate.
Automation frees up time
In IT, especially when automating mainframe processes, we encounter the same hesitation:
“We don’t need to automate this; once it’s done, we’ll never do it again.”
Which almost never turns out to be true.
Repetitive tasks-whether personal or IT-related-are often simple to automate but remain manual due to perceived time constraints.
In IT, automation is critical. It reduces manual errors, improves consistency, and frees up time for more strategic work.
A Shift in Mindset
Automation requires a different engineering mindset. Instead of the familiar cycle:
Do → Fix → Fix → Fix
We move to:
Engineer process → Run process / Fix process → Run process → Run process
Once engineered, automated processes run with minimal intervention, saving both time and effort.
When to Automate
If you find yourself performing a task more than twice, consider automating it. Whether through shell scripting, JCL, utilities, or tools like Ansible, automation quickly pays off.
Automation is not optional-it’s essential for efficient IT operations and professional growth. Start automating today to work smarter, not harder.
Don’t waste time doing things more than twice. If you do something for the third time, automate it-you’ll likely have to do it a fourth or fifth time as well.
In software engineering, as in many creative and technical fields, the environment shapes how we think and work. An intriguing psychological phenomenon known as the Cathedral Effect offers valuable insights into how physical and virtual workspaces can be designed to optimize both high-level creativity and detailed execution.
What Is the Cathedral Effect?
The Cathedral Effect reveals how ceiling height influences cognition and behavior. High ceilings evoke a sense of freedom and openness, fostering abstract thinking, creativity, and holistic problem-solving. In contrast, low ceilings create an enclosure that encourages focused, detail-oriented, and analytical work.
Research shows that exposure to high ceilings activates brain regions associated with visuospatial exploration and abstract thought, and confirms that people in high-ceiling environments engage in broader, more creative thinking, while low ceilings prime them for concrete, detail-focused tasks.
Applying the Cathedral Effect to Software Engineering
Software development involves both high-level architectural design and detailed coding and testing. The Cathedral Effect suggests that these phases benefit from different environments:
High-level work (system architecture, brainstorming, innovation) thrives in “high ceiling” spaces- whether physical rooms with tall ceilings or metaphorical spaces that encourage free-flowing ideas and open discussion.
Detailed work (analysis, programming, debugging) benefits from “low ceiling” environments that support concentration, precision, and deep focus.
Matching the workspace to the task helps teams think and perform at their best.
Practical Suggestions for IT Teams and Organizations
Create Dedicated Physical and Virtual Spaces
If possible, design your office with distinct zones:
High-ceiling rooms for architects and strategists to collaborate and innovate. These spaces should be open, well-lit, and flexible.
Low-ceiling or enclosed rooms for developers and analysts to focus on detailed work without distractions.
For remote or hybrid teams, replicate this by:
Holding open, informal video sessions and collaborative whiteboard meetings for high-level ideation.
Scheduling “deep work” periods with minimal interruptions, supported by quiet virtual rooms or dedicated communication channels.
Match People to Their Preferred Environments
We should recognize that some team members excel at abstract thinking, while others thrive on details. Assign roles and tasks accordingly, and respect their preferred workspace to maximize productivity and job satisfaction.
Facilitate Transitions Between Modes
Switching between big-picture thinking and detailed work requires mental shifts. Encourage physical or virtual “room changes” to help reset focus and mindset, reducing cognitive fatigue.
Foster Cross-Pollination
While separation is beneficial, occasional collaboration between high-level thinkers and detail-oriented workers ensures ideas remain practical and grounded.
Why This Matters
Ignoring the Cathedral Effect can lead to mismatched environments that stifle creativity or undermine focus. For example, forcing detail-oriented developers into open brainstorming sessions can cause distraction and frustration. Conversely, confining architects to cramped spaces can limit innovation.
By consciously designing workspaces and workflows that respect the Cathedral Effect, organizations can foster both creativity and precision, leading to better software and more engaged teams.
A final thought
The principles described here apply equally to how we approach complex technology decisions. Just as the wrong workspace can stifle creativity, the wrong mental framework can cloud strategic thinking. When IT leaders face complex platform decisions, like evaluating mainframe strategy, they need the right environment for both high-level thinking and detailed analysis.
If you are an IT leader navigating complex technology decisions, my book Don’t Be Afraid of the Mainframe provides the clear, structured framework you need, cutting through technical complexity so you can think at the right level for your role.
I must shamefully admit I was not aware of the zopen community initiative before it recently became part of the Open Mainframe project. The zopen community provides a great set of open source tools ported for Z. Such as the dos2unix utility I wrote about earlier here.
On z/OS UNIX, the dos2unix utility is not included. You can achieve similar functionality using other tools available on z/OS UNIX, such as sed or tr. These tools can be used to convert DOS-style line endings (CRLF) to Unix-style line endings (LF).
For example, you can use sed to remove carriage return characters:
In the realm of software development, the four-eyes principle dictates that an action can only be executed when it is approved by two individuals, each providing a unique perspective and oversight. This principle is designed to safeguard against errors and misuse, ensuring the integrity and quality of the software.
The four eyes principle can help during the construction of software systems by finding weaknesses in architecture, design or code and can help to improve the quality. In every phase of the software development cycle, this principle can be applied, from the requirements analysis phase to the detailed coding phase.
Software architecture, design, and code could be co-developed by two people or peer-reviewed.
In the design of software systems, the four-eye principle applies to the process of validating design decisions on various levels. Pair programming is a software development technique in which two programmers work together on code, one usually doing the coding and the other doing the validation. In other engineering industries, dual or duplicate inspection is a common practice.
In regulated environments such as Financial Institutions, compliance requirements may dictate that code is always peer-reviewed to prevent backdoors in code.
In software systems itself, the four-eyes principles may be implemented when supporting business processes requiring this for security or quality validation reasons.
Change management, a critical aspect of software development, often relies on the four-eyes principle. When code changes are transitioned into production, a formal change board may mandate a signed-off peer review, ensuring that all changes meet the required standards. Change and Configuration Management tools for software systems are often designed to support this four-eyes principle process, further enhancing the quality and security of the production environment.
Further assurance can be added by adding a (random) rotation scheme of authorized individuals to serve as the second pair of eyes. This may provide additional assurance as it will not be known beforehand which two individuals will be dealing with a given decision.